Advanced Visualization Laboratory
Advanced Visualization Laboratory
Data visualization involves graphical representation of data and in the context of the DARIAH-PL project, applies to both the source data acquired at the Source Laboratory, the results of data processing and analysis, and the final research results. It is a part of the research process since it presents data in a way that facilitates its understanding and interpretation. Visualization also makes it possible to present the results in a form that is attractive to a wider audience.
Visualization services offered at the Advanced Visualization Laboratory will be implemented in two areas: presentation of multimedia data (audio, video, 3D scans, VR) and spatial data (maps, cartographic visualizations). In both cases, data has a form of various sets of graphic objects, audio and numerical data, the integration and accurate presentation of which requires advanced software methods and hardware solutions. These requirements are due to not only form of the data but also the need to accurately reflect the details that are important elements of research results.
What Kind of Data are Visualized
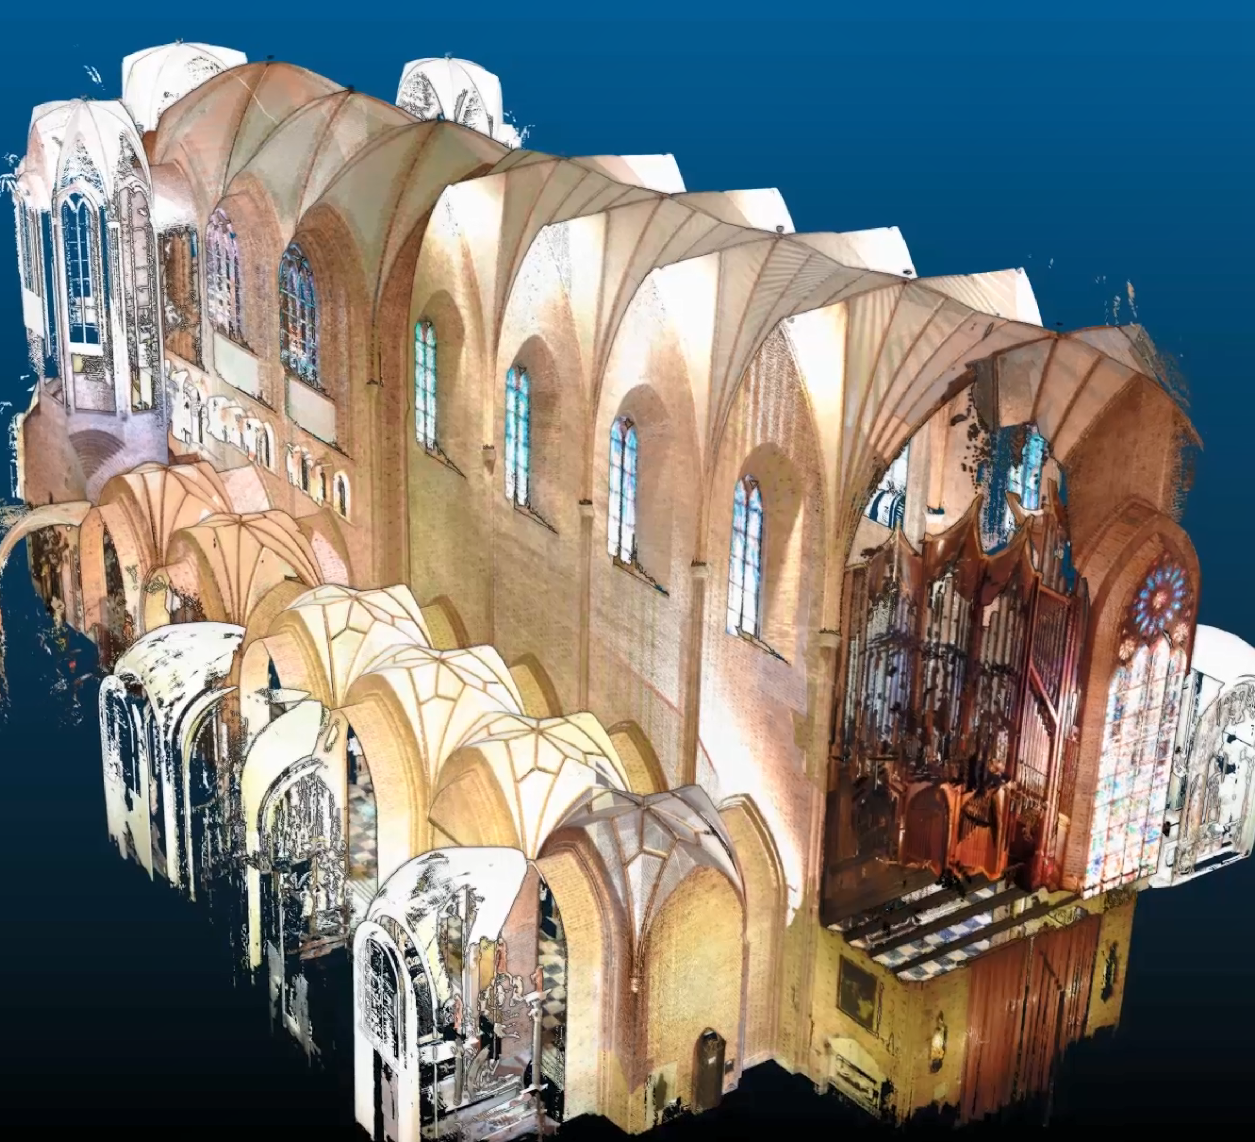
Visualization will be carried out for multimedia data acquired and developed in the Source Laboratory, such as point clouds which are three-dimensional representations of objects acquired by laser scanning. Also, data generated at the subsequent processing stages can be a subject of advanced visualization, for example the results of data analysis implemented in the Intelligent Analysis and Interpretation Laboratory, capturing relationships between objects and changes in the evaluation of these relationships.
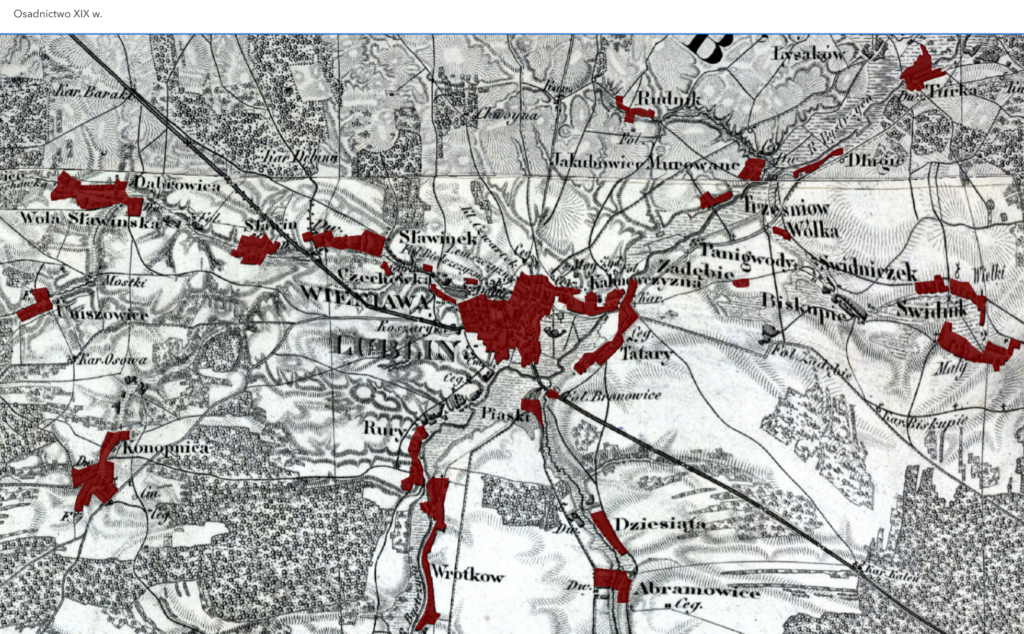
Spatial and spatio-temporal data, on the other hand, is related to a specific location or geographic area and may also refer to a specific moment or range of time. Presenting such data on a map provides a new perspective and facilitates a more complete understanding of the issue it represents. A map can present both qualitative data reporting only the occurrence of a phenomenon and quantitative data showing the intensity of a phenomenon. The Laboratory will provide a service for generating spatial-temporal visualizations.
2D i 3D Visualization
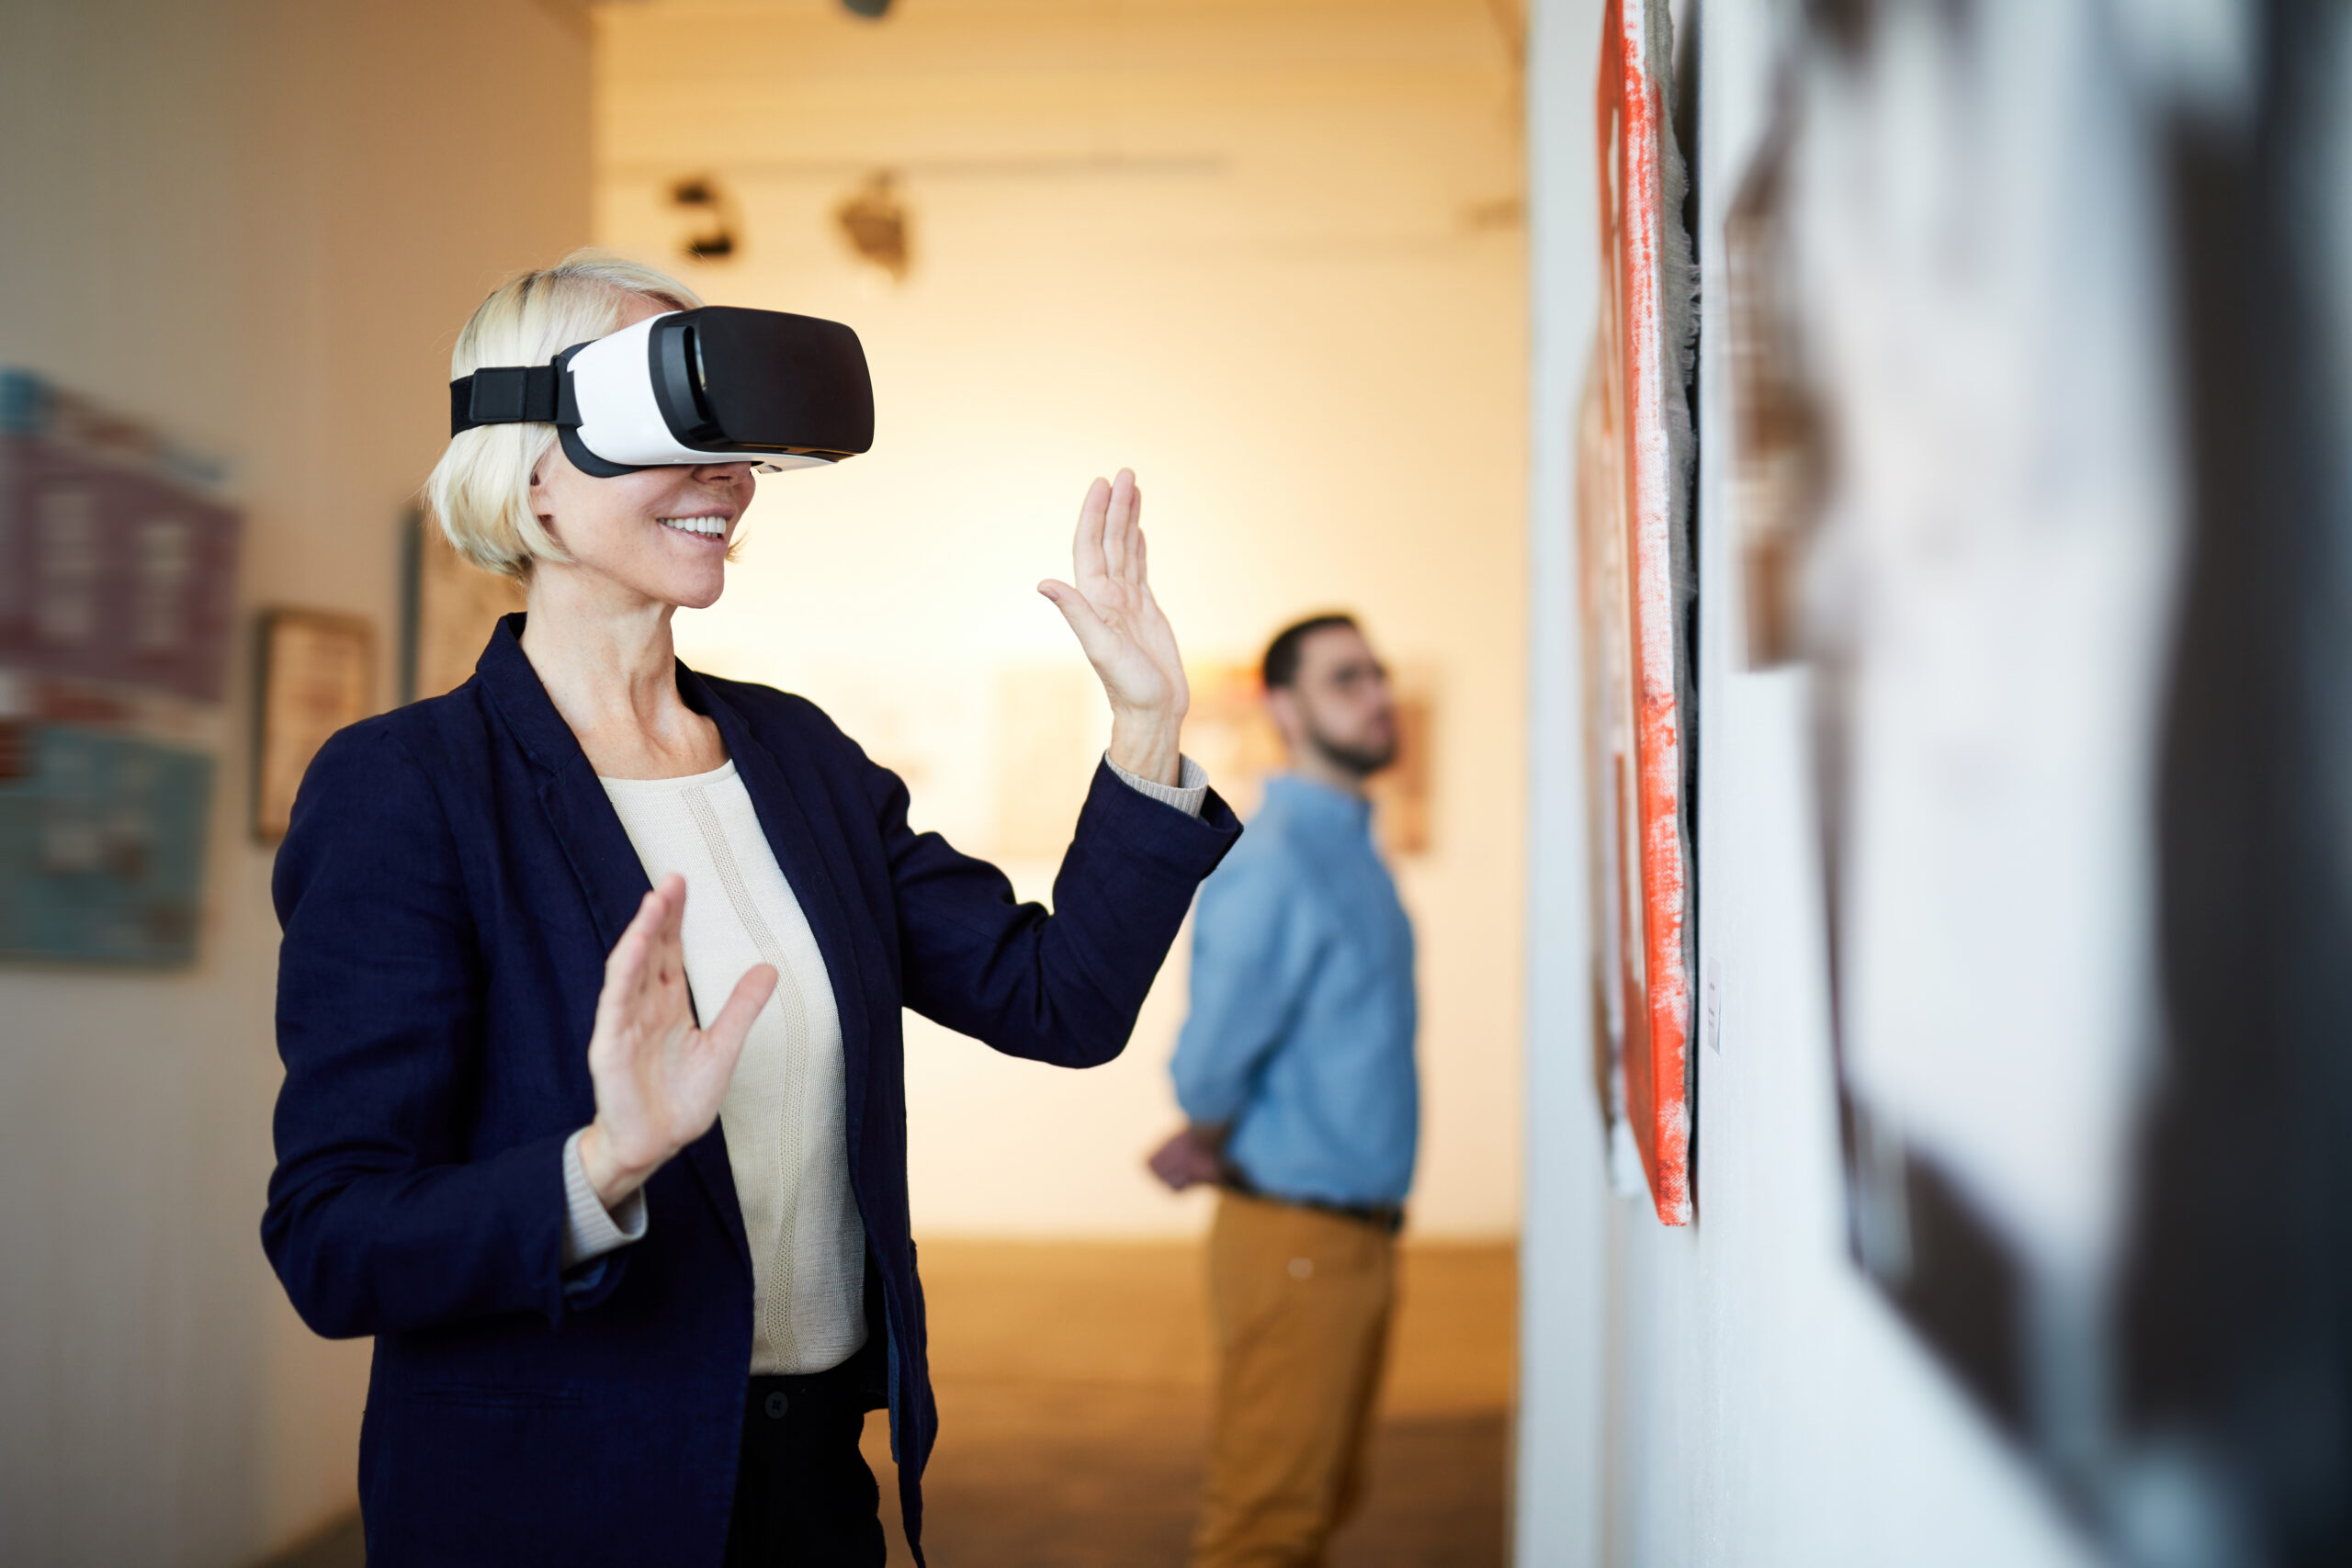
The Laboratory will offer an application for creating 3D, 360° and VR (Virtual Reality) visualizations and publishing multimedia content in the form of a virtual gallery, for example.
The application will allow visualization of point clouds along with the ability to embed 2D static images (graphic files), 3D models and other multimedia content such as video clips or immersive sound recordings in the virtual space. The application will create virtual spaces based on rendered 3D models or 3D scans in which so-called portals will be placed, presenting additional content, such as scans of images in various technologies (macro-scale photos, infrared photos), old prints, but also 360° video footage.
The system will semi-automatically generate a base visualization based on the user-submitted data and predefined object templates. The visualization generated in this way may be personalized by adding logos and graphic design provided by a user, inserting titles and captions. The result in the form of an interactive application, will be published and made available on the Internet or presented on 3D displays, VR devices or other advanced visualization systems.
Content Presentation
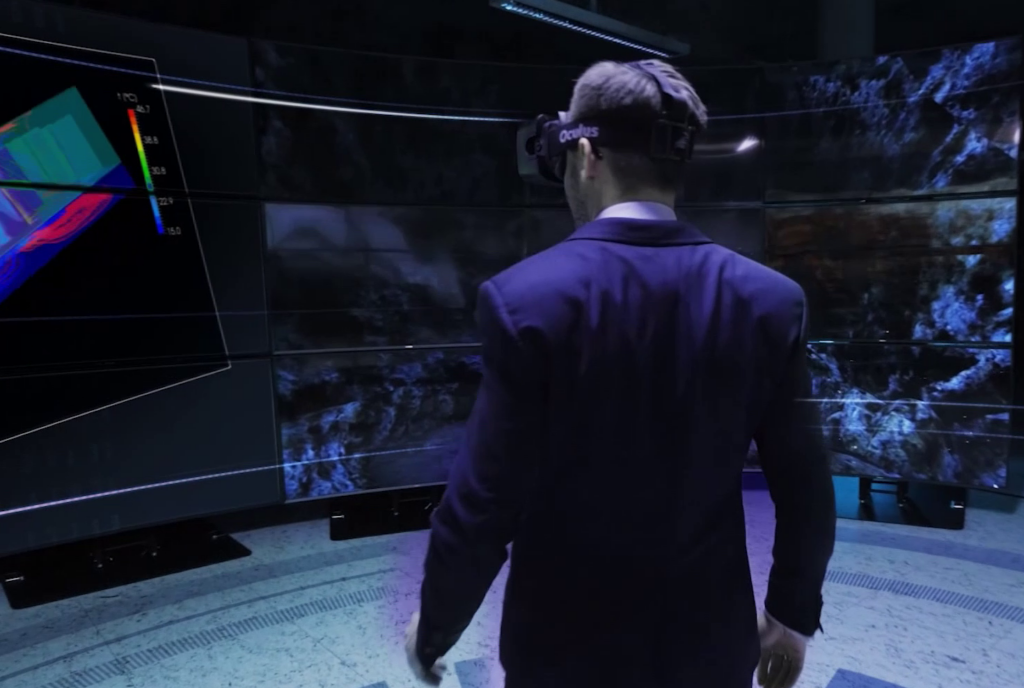
The Laboratory will offer infrastructure for content presentation using a variety of visualization techniques. It will contain large-format high-resolution 8K, 4K visualization systems with support for High Dynamic Range (HDR) mode, ensuring precise reflection of details and colors of objects, as well as modular 2D and 3D visualization systems, the configuration of which can be dynamically adjusted to a specific concept of use.
These installations will include: a large-format projection system consisting of projectors with a resolution of min. 4K and high brightness allowing for visualization and mapping in open spaces (e.g., on buildings) also in three-dimensional technology, immersive content presentation system consisting of a set of near-field projectors allowing for construction of any visualization installations, such as exhibitions in art galleries or museums.
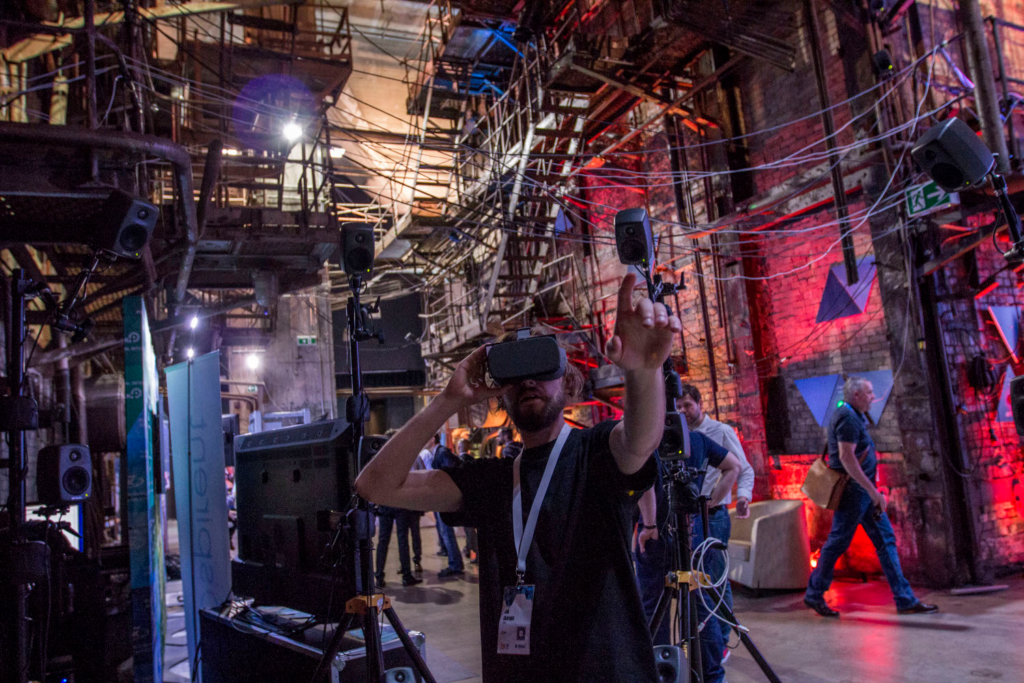
In addition, the Laboratory will be equipped with a system consisting of a set of virtual reality glasses with a system of trackers allowing users to interact with the virtual space, along with a surround sound playback system consisting of a multi-element speaker installation.
Spatio-temporal Data Visualization
The Laboratory will provide a cartographic visualization service for spatial data in the form of multi-layered maps. This web-based service will include a set of tools dedicated to developing visualizations using methods for presenting qualitative (e.g., occurrence of certain animal species, mineral deposits, etc.) and quantitative (e.g., population density, city size, etc.) data.
Once the data is entered into the system, it will be possible to establish its association with spatial reference units. Among the available reference sets there will be the databases of the State Register of Borders and the State Register of Geographic Names, the OpenStreetMap address database, and the data collected in the repository of geodata cartographic content made available in the Dariah.lab infrastructure.
The service will generate customized map visualization in the form of vector or raster graphics made available in web interactive application . The service will be offered to a wide range of users who want to make a cartographic presentation of spatial data (map, web map, cartographic visualization), but do not have expertise in this area.